SoftActivity Monitor – Installation Guide for Administrators
Contents
- Express Installation
- Supported Operating Systems
- Components
- Install SoftActivity Monitor Server Components
- Install Client App (agent) on monitored computers
- View user activity in real time – Admin Console application
- Set up access to Web Console and view logs
- SoftActivity Webapp Administration
- Updating the application
- Uninstalling the application
Express Installation
Install SoftActivity Monitor with these steps:
- Download the SoftActivity Monitor installation package.
- Run the installation package on a Windows Server machine inside your company LAN, or on an administrator’s PC.
- Click
Nexton each page of installation. - Open SoftActivity Monitor Admin Console.
- Install the Client App remotely on the computers you want to monitor in your local network.
- Click a computer name in SoftActivity Monitor to start monitoring user activity.
For more advanced configuration and tuning, follow the detailed steps below.
Supported Operating Systems
SoftActivity Monitor Server, Monitoring Console, and Webapp Server: Windows 11 to 7 x64, or Windows Server from 2008 R2 x64 to the latest version. Only 64-bit Windows editions are supported since SoftActivity version 12.0. Both domain-joined and workgroup computers are supported.
PostgreSQL Server: Version included in SoftActivity installer: any Windows version, 32- or 64-bit. Downloaded from https://www.postgresql.org/: Linux, Windows, macOS
Agent: Client App for monitored computers: Windows 11 to 7, 32- or 64-bit edition.
For more details and up-to-date information visit System Requirements section.
Components
SoftActivity Monitor consists of the following components according to the Deployment Architecture diagram. Some components are optional. Server components can be installed on a server or even on an administrator’s PC in a small office, or scaled to separate servers for better performance in an enterprise environment.
- SoftActivity Monitor Server and Admin Console. Required component. It includes:
- Admin Console desktop application, used by an administrator for live monitoring of remote computers, remote Agent installation, Agent list management, monitoring settings, and server settings.
SalogSrvservice that runs in the background, downloads logs and screenshots from Agents, and stores them in the database.
It can share a computer with the Webapp Server and PostgreSQL database server, or it can be installed on a separate machine.
- SoftActivity Webapp Server. Optional component. It hosts a Web Console for viewing recorded logs. The Webapp Server runs on port
8081by default. It can be installed on the same machine as SoftActivity Monitor Server and the database server, or on a dedicated server. The Windows service name isSawebSrv. - PostgreSQL database server. Optional component. https://www.postgresql.org/ is used for storing logs recorded by Agents and downloaded by SoftActivity Monitor Server. PostgreSQL can be installed on Windows or Linux, on a dedicated server, on a cluster, or on the same machine as the other components.
It can be installed on Windows Server by the SoftActivity installer, which also creates a default database. PostgreSQL runs in the Windows serviceSapgSrv.
Optionally, you can install PostgreSQL separately. SoftActivity currently supports PostgreSQL versions9.5+. - Monitoring Console. Optional component. Desktop application for additional supervisors or managers who need to view user activity in real time. Install SoftActivity Monitor and select Monitoring Console mode in Options, or switch to this mode in SoftActivity Monitor Options. Only a user with local administrator rights can switch between Server and Monitoring Console modes. A supervisor needs to know the Agent password to connect to a monitored computer.
- Agent. Required component. Client application installed on monitored computers.
- Works silently in the background and records user activity.
- Has no UI and shows no icons or windows to a monitored user unless aware mode is enabled.
- Agent password must be set by an administrator during installation.
- Agent can be deployed remotely from Admin Console, via Group Policy, or by running the installation package locally.
Install SoftActivity Monitor Server Components
Server components can be installed on an administrator’s PC in a small network or on a Windows Server machine in a larger organization.
- Download the SoftActivity Monitor installation package from the SoftActivity website. It is recommended to open the file Properties -> Digital Signatures tab and verify that the file is signed by Deep Software Inc.
- Run the installation file. You can install it by clicking
Nexton each page. No advanced configuration is required, but you may change options on the setup pages below. - Select
Server Modeand clickNext. Select all components for installation and clickNext.

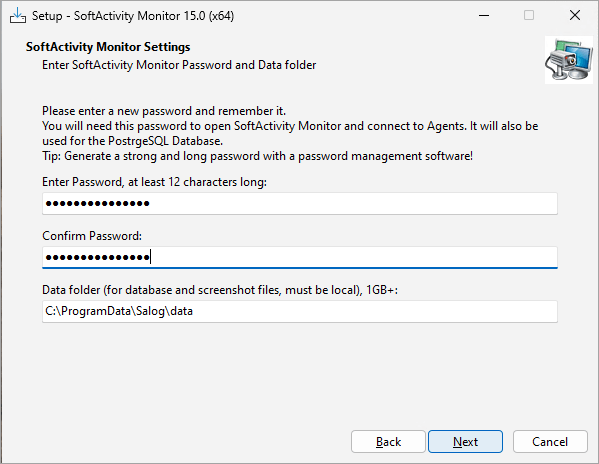
- Choose a strong admin password for SoftActivity Monitor, at least 10 characters long, and enter it twice. This password will also be used as the default password for the database server and for Agents.
- Enter a folder path for storing logs and screenshots. We recommend at least 1 GB of free space per monitored computer on local storage. The folder does not have to exist and will be created during installation. You can also keep the default folder on drive
C:if it has enough free space. ClickNextto continue.
- On the next page, you can select a port number for the Webapp Server. By default, it is
8081. Later, you can view logs in a web browser athttp://localhost:8081. - On the next page, you can enter a password for the PostgreSQL database server, or reuse your SoftActivity Monitor password, and select a TCP port number for the database server. Changing it from the default is not recommended unless the port is already in use.
- Click
Installand wait until installation finishes. - Open SoftActivity Monitor Admin Console and enter your chosen password to log in.

Note: SoftActivity Monitor supports silent installation with special command line parameters. See a list of supported installer command line parameters.
Install Client App (agent) on monitored computers
To monitor computers on your network, install the Client App on them first. This can be done remotely from SoftActivity Monitor Admin Console or using Microsoft Intune. Domain Admin or similar administrative permissions are typically required for remote installation.
Read the complete installation guide for SoftActivity Monitor Client App: How to install SoftActivity Monitor Client App: Admin Guide
For off-premise or cloud-managed computers where the Monitor server cannot connect directly to the client, use External Agent mode: How to monitor remote off-premise computers with SoftActivity Monitor External Agent mode: Admin Guide
Once the Client App is installed, go to SoftActivity Monitor Admin Console and click Search Network for new Agents on the top toolbar. This should take a few seconds to find all active Agents installed in your local IP subnet and add them to the list on the left side. Other computers can be added manually. Click Add Agent and enter the remote computer’s DNS host name, or a static IP address if needed.
View user activity in real time – Admin Console application
Once Agents are installed and added to the list in SoftActivity Monitor Admin Console, you can double-click any computer name in the list to start viewing its screen and monitoring user activity remotely in real time.
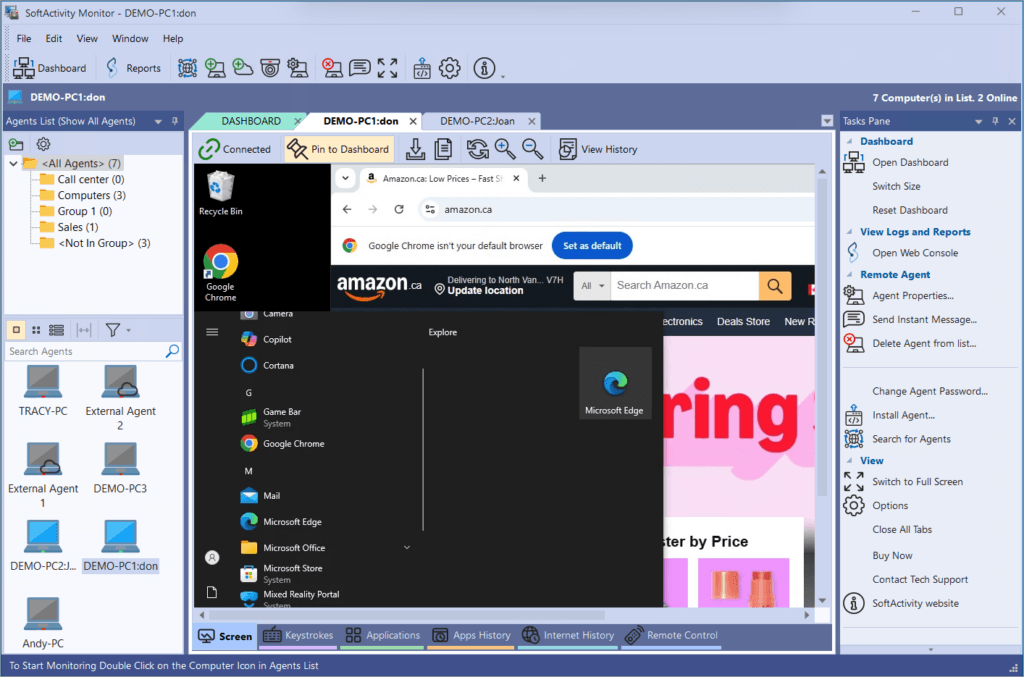
- Switch tabs at the bottom of a monitoring window to view a screen, typed keystrokes in real time, a list of running applications and processes, visited websites, and more.
- Drag computers from the list to the Dashboard to view smaller live snapshots of their screens.
- You can tear off the Dashboard tab and place it on a separate monitor to keep an eye on remote computers, like a security camera.
Set up access to Web Console and view logs
Once an Agent is installed and added to Admin Console on the server, the SalogSrv service starts downloading logs and screenshots from the Agent and storing them in the database. You can then view the results in the Web Console:
- You do not need to keep Admin Console open unless you are using it for live monitoring. Agent logs are downloaded in the background by
SalogSrv. - To view logs and screenshots recorded on monitored computers, log in to the Web Console.
- Click
Open Web Consolein Admin Console, or open a web browser and go tohttp://localhost:8081, where8081is the Webapp Server port configured during installation. - Default credentials:
- user name:
sadmin - password:
changeme
- user name:
- Immediately change the password in the Web Console:
- Click
sadminin the top-right corner. - Click
Edit Account. - Open the
Passwordtab, enter and confirm the new password. - Click
Save changes.
- Click
- Set the data retention interval. By default, logs are stored indefinitely and may consume all available drive space.
- Go to
Administrator Panel -> Application Settingsand select a retention interval. One month is a reasonable starting point.
- Go to
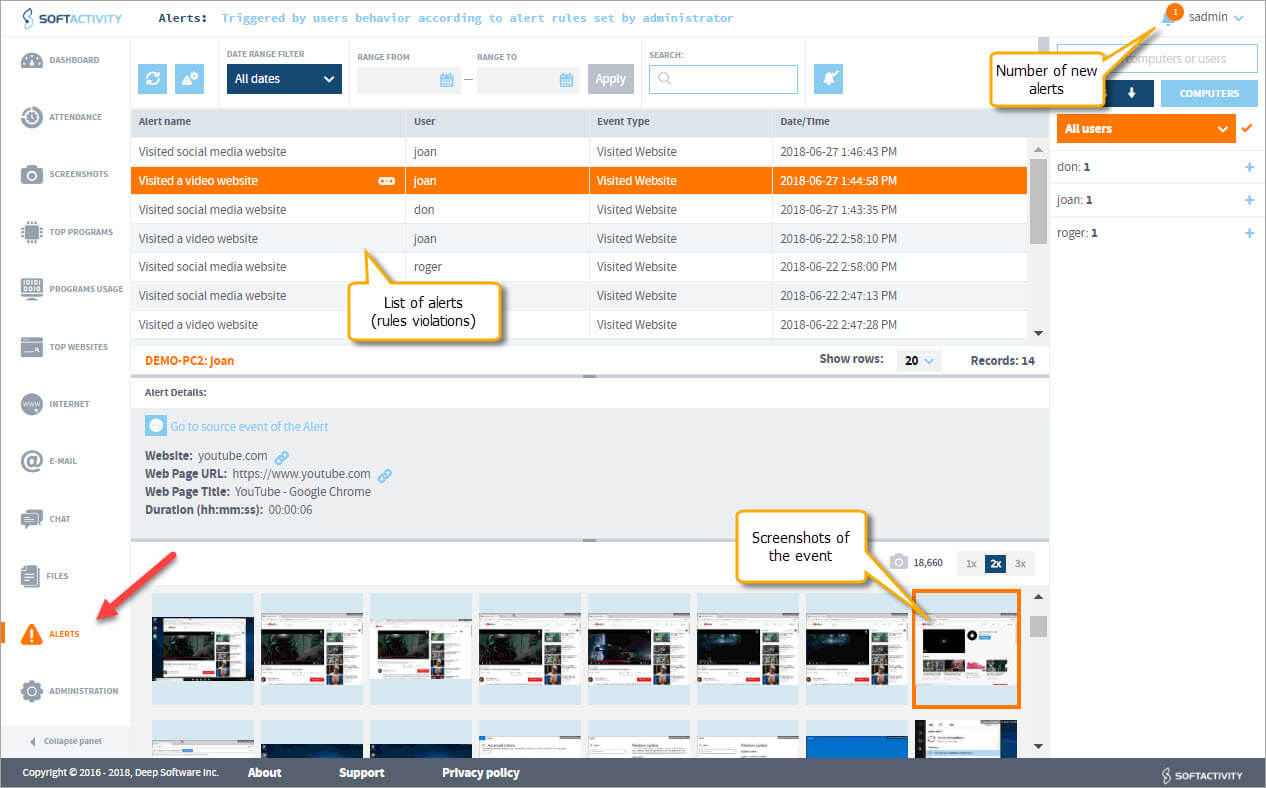
- Click
Top Programs,Top Websites,Internet,Screenshots, and other tabs on the left side to view activity. - Select a user and/or computer on the right side to filter logs.
- New logs should appear in the Web Console every 1-2 minutes, or less often depending on the number of monitored computers and network speed.
- Alerts appear in the top-right corner next to the user name.
- To receive alerts by email, enter SMTP server details in Admin Panel and add your email address under
Edit Account.
- To receive alerts by email, enter SMTP server details in Admin Panel and add your email address under
SoftActivity Webapp Administration
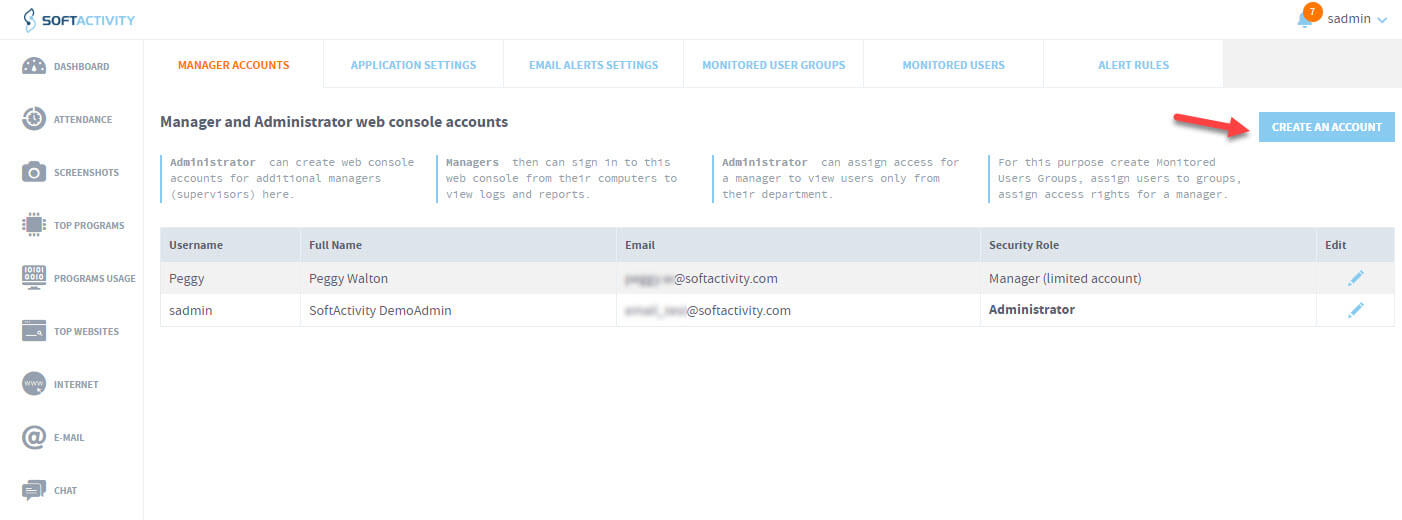
In the Webapp Admin Panel, an administrator can:
- Create and manage limited accounts for supervisors and managers. Go to
Administrator Panel -> Manager Accounts. - Create and manage accounts for other Webapp administrators.
- Set the retention policy for stored logs. By default, logs are stored indefinitely.
- Organize monitored users in groups and assign access permissions for supervisors to groups or individual users.
- Edit alert rules and company computer-use policies. Create new rules or edit the default rules.
- Enter SMTP server details to receive alerts and weekly reports.
- Delete logs for users that are no longer needed. Go to
Admin Panel -> Monitored Users, click a user, thenDelete User. - Set up automatic email reports for each manager account individually. See How to set up email reports and alerts in SoftActivity.
- Review administrator and manager actions in
Audit Log.
How to change the Web Console TCP port number (default 8081)
- Open
SoftActivity Monitor Admin Console -> Options -> General -> Configure Webapp Server - Or run:
"%ProgramFiles(x86)%\SoftActivity\Activity Monitor\tsmcfg.exe"
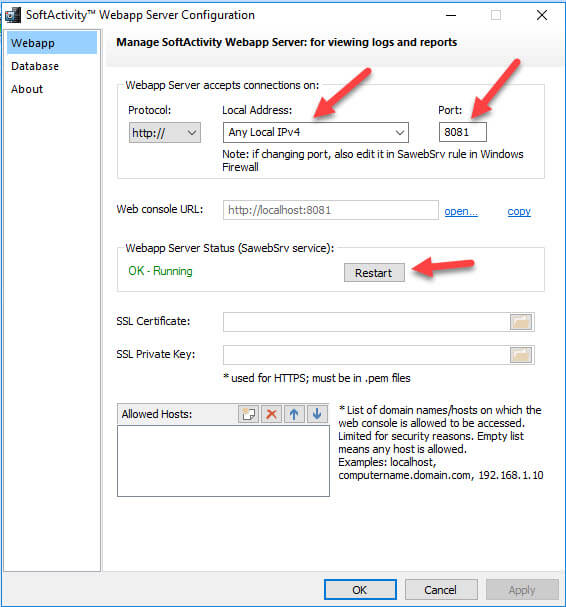
Change the port number and other settings.
From here you can also:
- restart the Webapp service
- enable HTTPS access to the Web Console
- check or change the database connection on the
Databasetab
Read the detailed SoftActivity Webapp instructions for Admins
Updating the application
An administrator can update SoftActivity Monitor to the latest version with these steps:
- Open SoftActivity Monitor Admin Console and click
Help -> Check for Updates, or go to the SoftActivity website and clickUpdate Now. - Download the latest installation package.
- Run the installation package on the computer or server where SoftActivity Monitor Server is installed. It should detect the existing version and offer an update.
- Update Agents remotely:
- Once you open Admin Console, it should detect Agents with an older version and offer to update them.
- Select
Do this for all computersif desired and clickOK. - Agents will be updated remotely and silently.
- A restart of monitored computers is not required in most cases.
- After installing an update, it may take a few minutes for the database to be updated before new logs from Agents start appearing in the Web Console.
Uninstalling the application
- Uninstall an Agent from monitored computers:
- Remotely: open SoftActivity Monitor, right-click a computer name in the list and click
Uninstall Agent. - Locally on a monitored computer: log in as an administrator, press
Win+R, runagentcmd /uninstall, and clickOK.
- Remotely: open SoftActivity Monitor, right-click a computer name in the list and click
- Uninstall SoftActivity Monitor Admin Console and Server from your computer or server:
- Open Control Panel in Windows, click
Uninstall a Program, select SoftActivity Monitor, and clickUninstall. - This uninstalls all components, including the database server and Webapp Server.
- Note: the data folder containing database files and screenshots is not automatically removed unless selected during uninstall. By default it is
C:\ProgramData\Salog\data.
- Open Control Panel in Windows, click